Visual data integration layer turning feeds into live platform content.
Client: Monterosa
Role: UX Lead
Date: 27-01-2025
Visual data integration layer turning feeds into live platform content.
Client: Monterosa
Role: UX Lead
Date: 27-01-2025
Visual data integration layer turning feeds into live platform content.
We spotted a pattern; every new client project burned around 20 days of resource in Sprint Zero just to get their data working with our platform.
At least 10 times per year, so a minimum of 200 days (or close to £100,000), spent every year on integration work. We built the case for internal investment around one idea: this wasn’t a one-off saving, it scaled with the company’s own growth targets. 20 new clients the following year meant £200,000 of value; 50 meant £500,000. That’s what got the project greenlit.
I led the UX and already knew the platform’s data model inside out as Product Owner of FanKit, the toolkit built on the same platform. I worked directly with our Extensions & APIs PM, sales team and account managers to keep every decision tied to real client need.
Constraints: build inside the existing Studio design system. No new visual language.
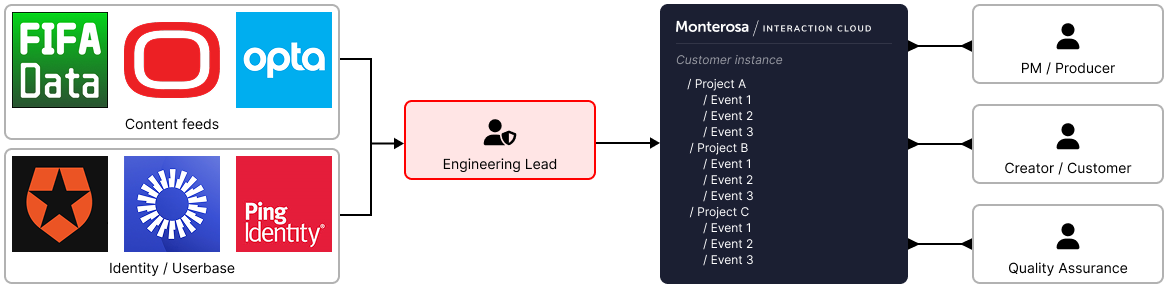
The problem wasn’t speed. It was knowledge locked in engineers’ heads: structural mismatches, inconsistent formats, missing fields, none of it written down anywhere. The job was making that knowledge visible so non-engineers could use it.
FanKit gave me the platform’s data structures from the consuming side, so I could sit with engineers and talk specifics: field types, null handling, nesting depth, not just “make it easier”. Priority and design decisions were then shaped by testing directly with real-world clients alongside the PM and commercial team, not assumption. That pushed the design towards trust and clarity as the core problems, not just speed.
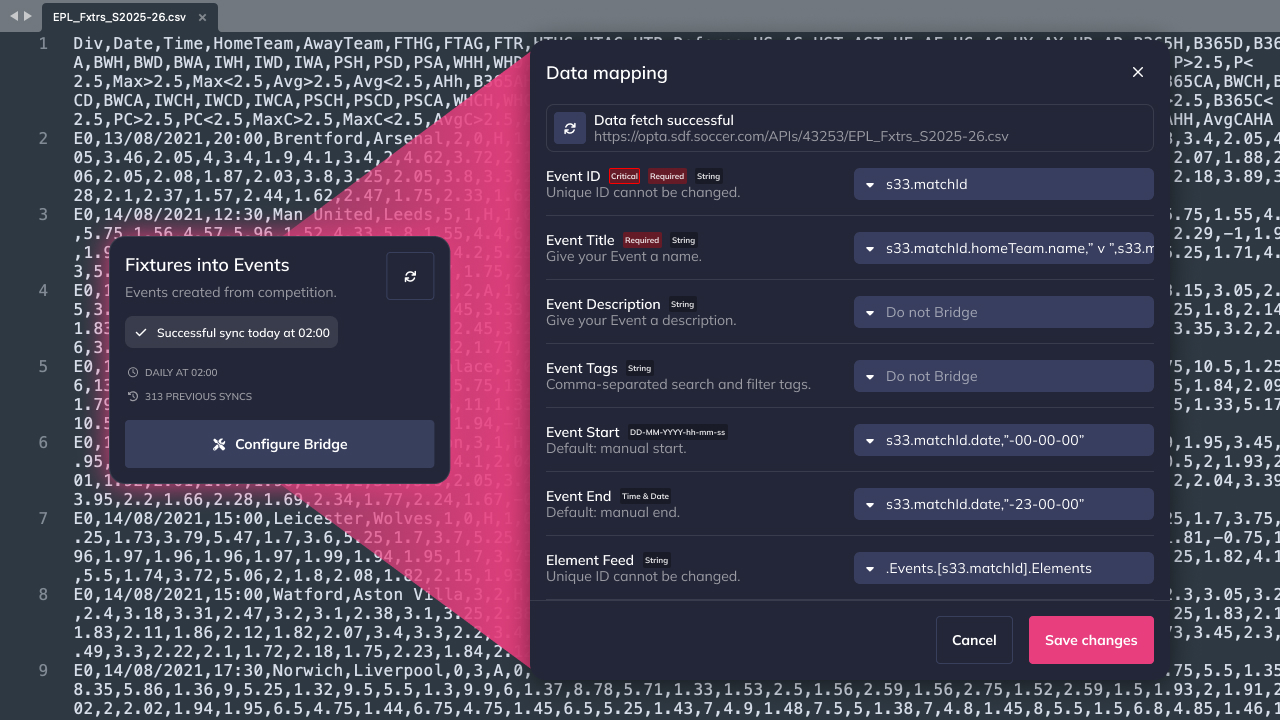
Core idea: a visual bridge between a client’s raw feed and the platform’s data model. Show both structures side by side. Let a non-engineer map one to the other.
Built inside the existing Studio design system throughout, non-negotiable. This audience needed to trust the tool enough to use it unsupervised.
Three capabilities did the work, delivered in phases and shaped by client testing:

Process for every new screen:
Three new components from Content Bridge, since reused elsewhere on the platform:
Mapping interface. Made “this field becomes that field” concrete for someone with no engineering background. The premise of the whole tool rested on this.
Formatter layer. Live preview against sample data. The effect of a formatting rule was always visible before it went live.
Audit log. Real-time feeds need human correction: results get fixed, timestamps drift, brand edits happen by hand. Every change traceable to system or person, every change reversible. This is what let engineering hand the tool over.
Data integration moved from engineering’s private domain to a configurable, auditable part of the platform, operable by producers, PMs and eventually clients directly.