Problem: The Scalability Wall
In any complex data ecosystem, the “Setup Phase” is frequently a significant point of friction. For this platform, every new integration required approximately 10 days of high-cost Engineering Lead resource to manually navigate, map, and transform fragmented data structures. Because there was no visual interface for this transformation, the business was forced to rely on senior engineers to write bespoke scripts for every new client.
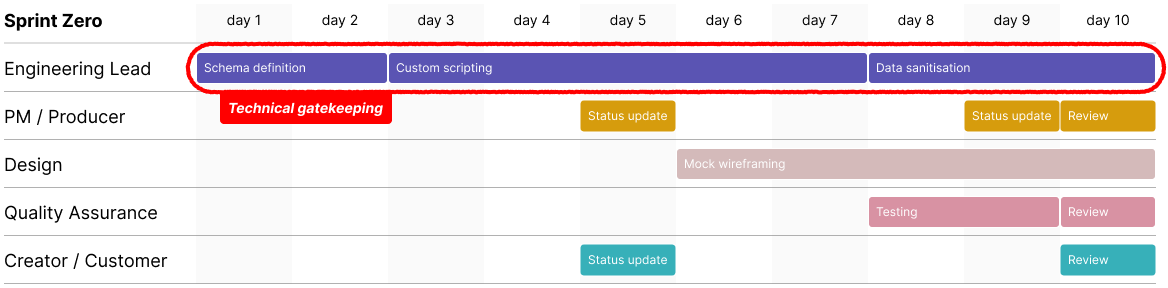 This created a “black box” environment. The Engineering Lead and their developers were the sole gatekeepers of the data. While they successfully sculpted the raw feeds from sources like FIFA or Opta to work with the platform, the logic remained hidden in the code base.
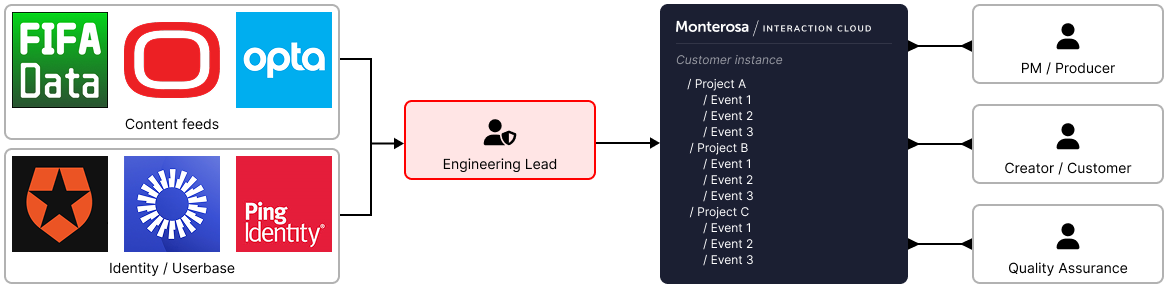 This technical debt had a ripple effect across the project. Product managers and producers were forced into a passive role, waiting for engineering completion and unable to verify or adjust data once live. The customers themselves were entirely removed from the process; they received a working solution but had zero agency to touch, fix, or play with their own data feeds. The setup phase was costing the business upwards of £10,000 per project in senior salary hours alone.
Discovery: Decoding the Mental Model
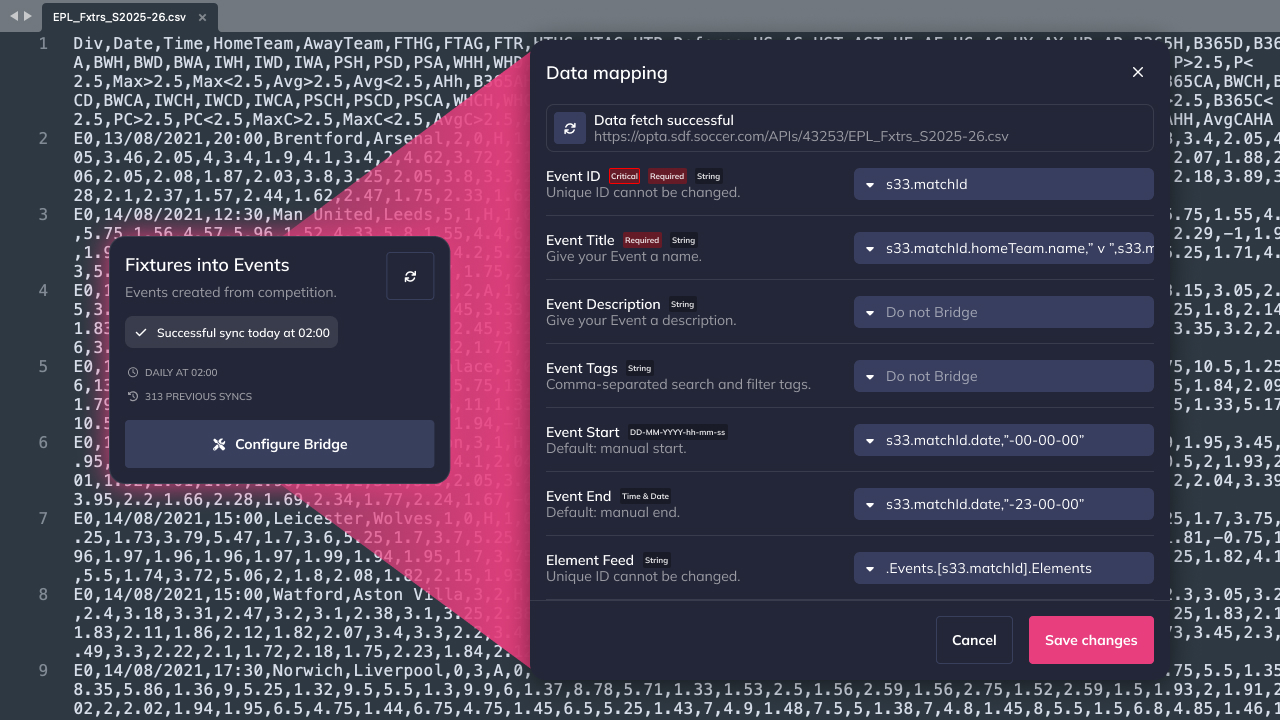
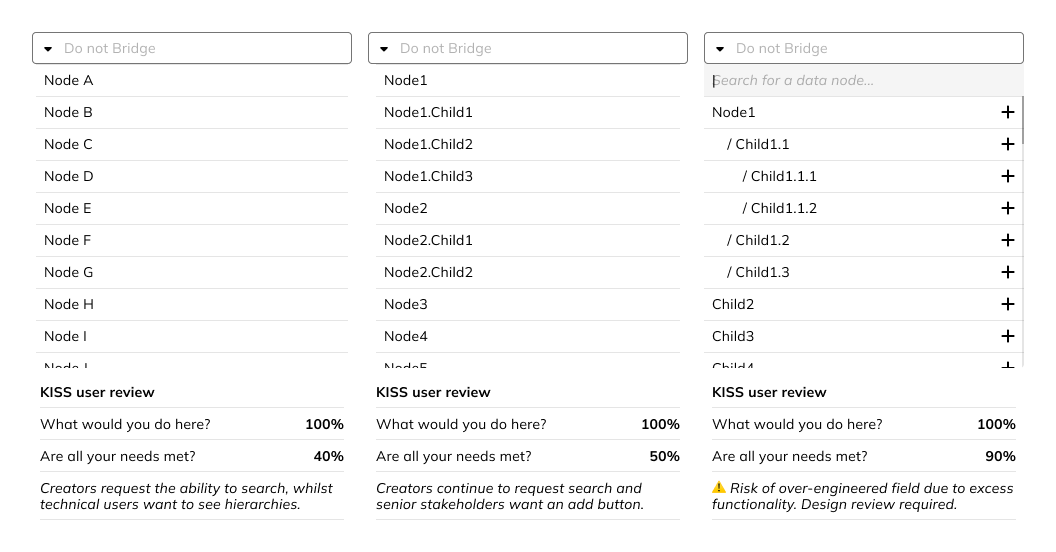
To move this task away from senior engineering, it was necessary to first understand the invisible logic being applied. Through a series of workshops with the engineering team, the goal was to deconstruct their mental checklists. It became clear that the challenge was rarely about simple field names; it was about structural intent-handling deep nesting, reconciling inconsistent timestamps, and managing missing values.
The design challenge was not to build a tool that simply “moved data”, but to create a visual language for data transformation that was accessible to non-engineers.
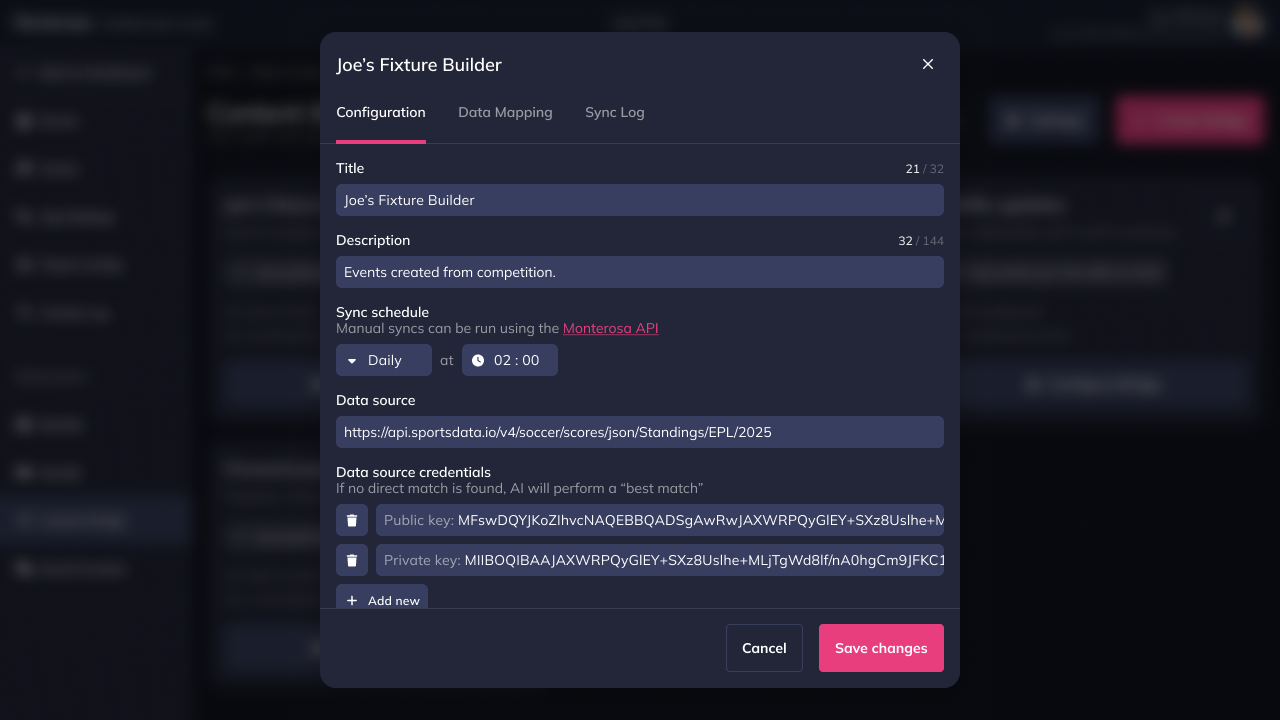
Pivot: Just-in-Time Provisioning
A design-first approach requires an understanding of the economic reality of the system. The initial technical hypothesis leaned toward bulk-importing millions of historical records. However, prototyping and cost-analysis revealed that the infrastructure fees would be astronomical, potentially reaching tens of thousands of pounds.
By advocating for a Just-in-Time (JIT) provisioning model, the design shifted the focus to on-demand data fetching. This ensured the user was always presented with the most relevant information while simultaneously removing a massive financial hurdle for the business.
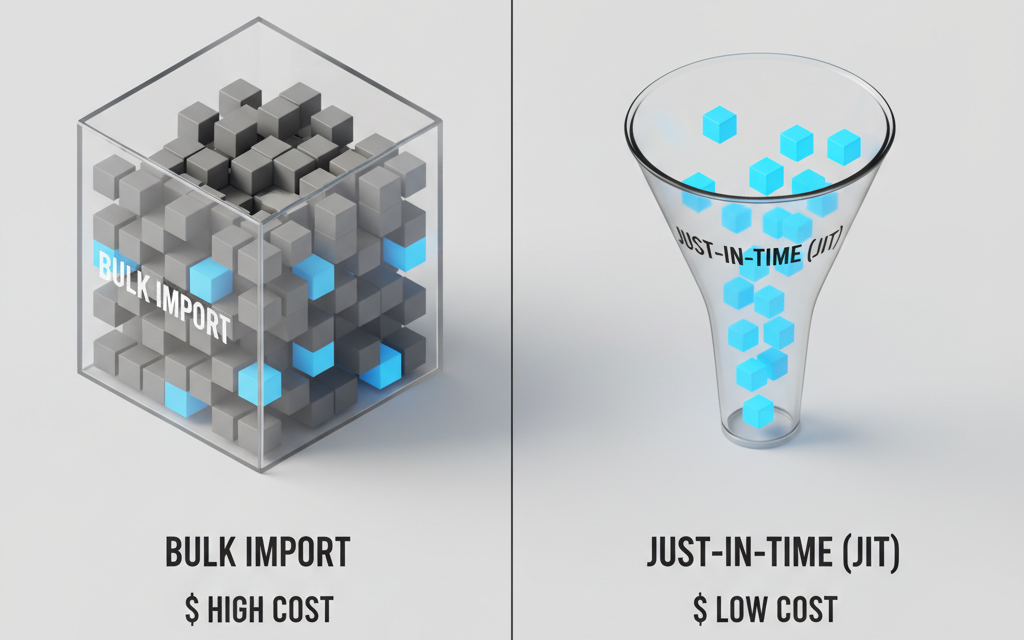
AI-generated for illustrative purposes within this case study
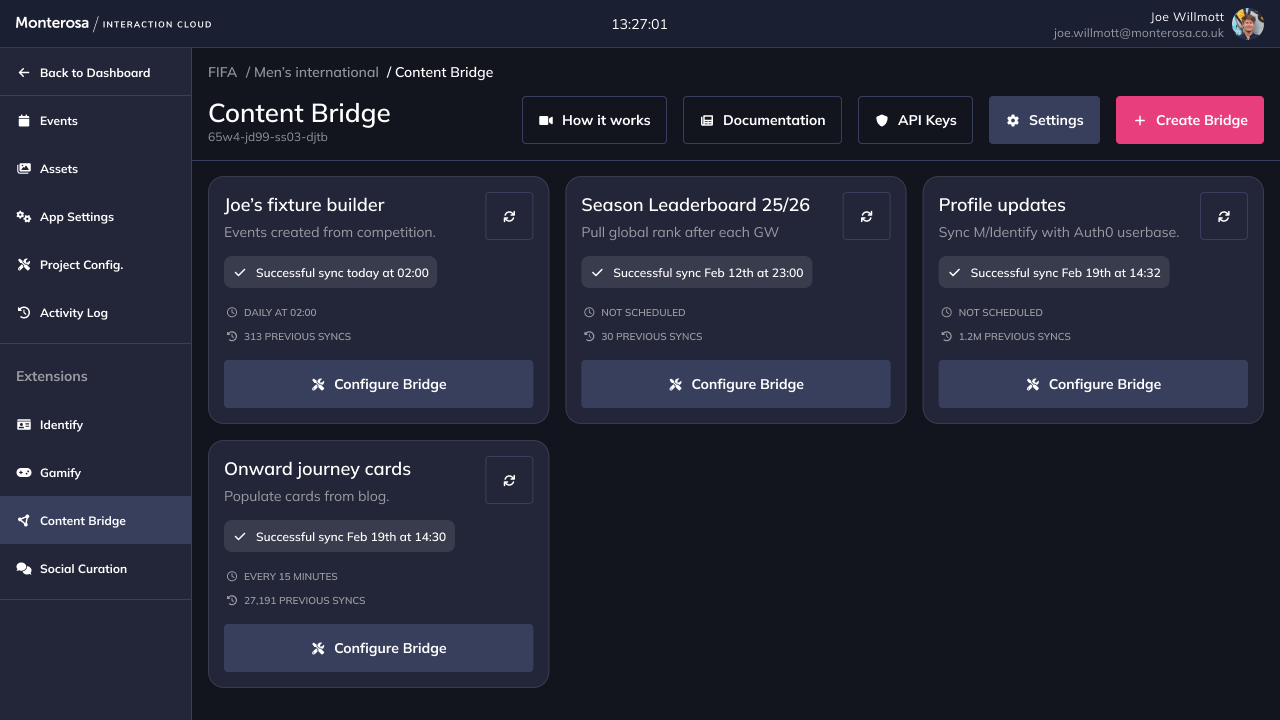
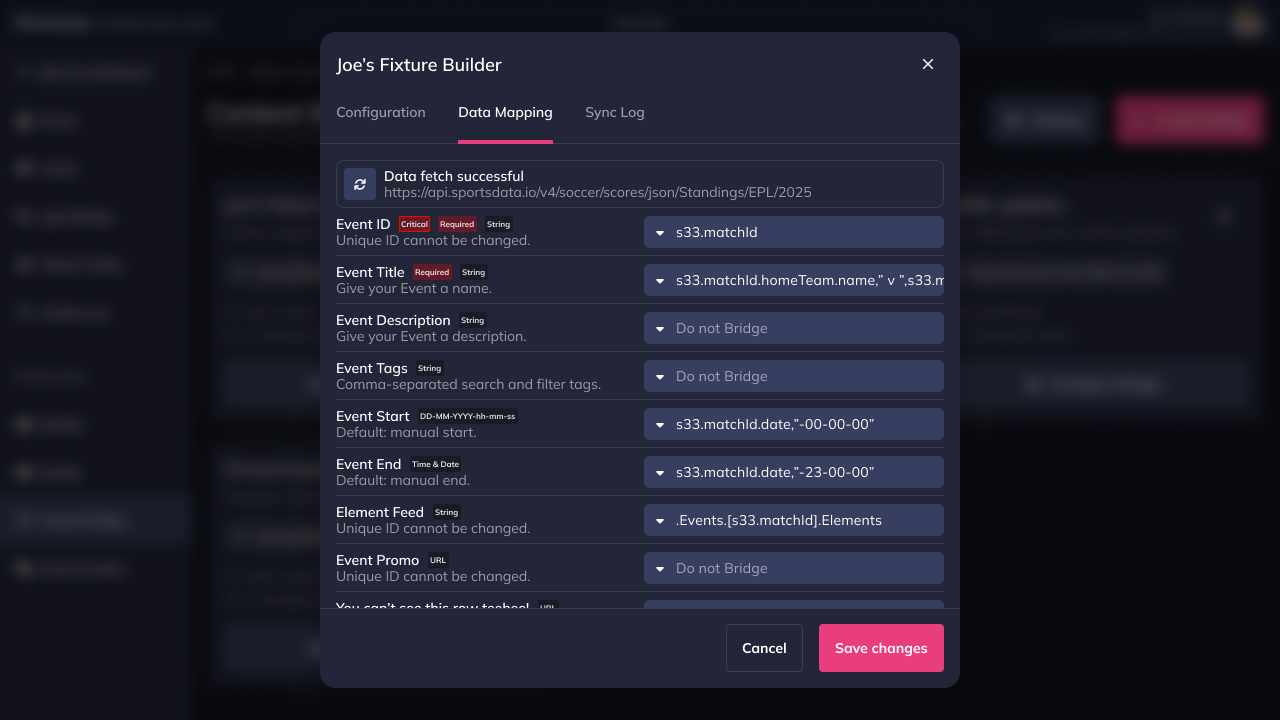
Solution: A Fail-Safe Experience
The resulting interface, Content Bridge, was designed to act as a safety gate for a much broader group of users. By providing a side-by-side visual bridge, the platform made complex relationships tangible for junior developers and project managers alike.
A key element of this experience was the Formatter Layer; a dedicated space where users could define rules for date or number formatting with a real-time preview. During development, the team deliberated between skeleton loaders and standardised spinners for the JIT data fetch. Despite trends favouring skeleton screens, user testing was inconclusive. A pragmatic design decision was made to utilise a standard spinner, allowing the team to reallocate three days of engineering effort into more critical safety features.
Integrity: Audit and Accountability
In high-stakes environments, transparency is the foundation of trust. Because real-time feeds often require manual human correction either to fix sensor errors or to ensure entries feel “on-brand” it was vital to include a comprehensive Audit Log.
This log distinguishes clearly between system-led ingestions and manual human edits. By including a one-click rollback feature, the design addressed the “fear of breaking things” that often prevents delegation. This safety net allowed senior engineers to finally trust the system enough to hand over the configuration to the wider project team.
🚨 Audit Log & Rollback UI. This is ‘Reliability’ proof. Show ‘Diff’ view (Old Value vs New Value). Highlighting the ‘Rollback’ button as a primary safety action.
Result: Opening the System
The impact of Content Bridge was measured not just in time, but in the democratisation of the project setup. By removing the technical gatekeeping, the task was opened up to the entire project team.
A task that previously occupied 80 hours of an Engineering Lead’s time is now completed in under an hour by a junior developer or a producer. Projects now reach the “go-live” stage two weeks faster, and the company has realised a 21% resource saving per project. Most importantly, the system is no longer a “black box”; it is a usable, configurable tool that provides every stakeholder with the headroom to manage their own data.
🚨 ROI Infographic. Compare ’10 Days (Eng Lead)’ vs ‘<1 Hour (Multi-User)’. Use visual that implies ‘Speed’ and ‘Scale’. Business impact!